Maritimo
Real time information on ship movements.
Maritimo is a set of applications used to decode, persist and display AIS data. It aims to be fast, scalable and easy to extend.
AIS (Automatic Identification System) is an automatic tracking system. AIS transmitters are equipped in vessels, navigation markers, and shore stations. These transmitters emit data related to the vessel or object they’re fitted on including position, heading, speed, course and more. This information is then used by other vessels to avoid collision or by ports and maritime authorities in their traffic monitoring systems.
I’ve worked with AIS systems and data for most of my career and the most exciting projects I was involved with usually revolved around it.
The applications are limitless: In Angola we used it to automate actions based on ships’ locations (for example: populating a database with container manifest data when a ship arrives to a port, or emitting taxation documents for agents when it sails away). Back in Portugal it was used to secure and police the coast and to help VTS operators guide ships inside a bay.
While those projects were pretty successful and helped both users and customers a lot in their daily interactions with the software, as I’ve moved on and got to work on other things I’ve kept thinking about those past applications.
Now that I’m not bound by inexperience or deadlines there were architectural decisions that I would have made differently from then. That was the main motivation to start Maritimo. It was a way to explore the ideas I had accumulating over the years and test them out in the field.
The real stations were the friends we made along the way
The lifeblood of any AIS system is its data - without real-time data it’s hard to develop and test to see if the decoder and/or the map is working correctly or not. In this case, the data comes from AIS receiver stations usually close to the shore. Living away from the sea I had little success in actually getting any data when I borrowed one of these equipments myself.
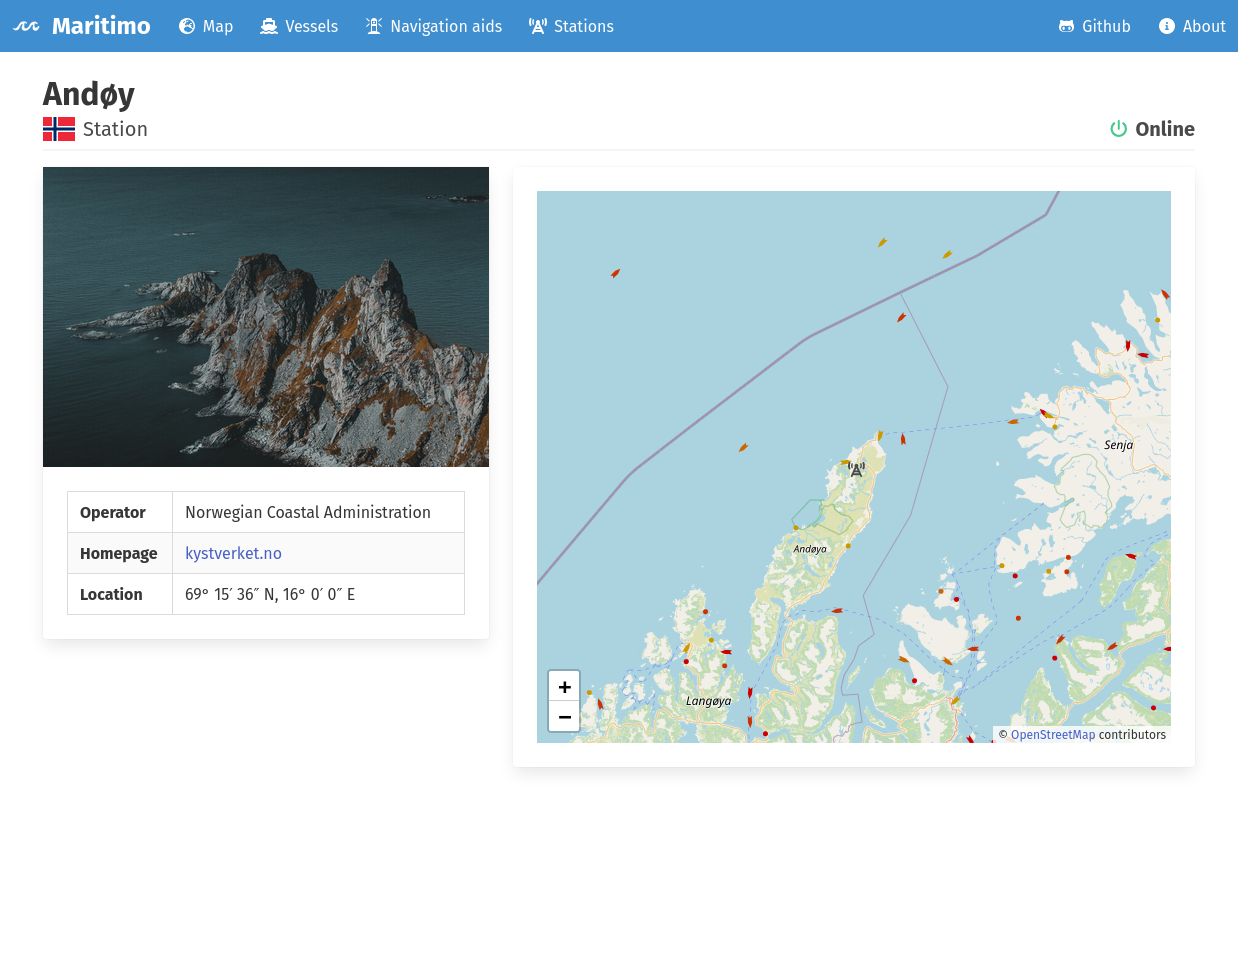
There are companies out there that supply AIS feeds but they usually offer them at a very high premium. Fortunately, I found out that Norway’s Coastal Administration supplied their feeds for free! An example that I wished more public organisations would follow. It was immensely helpful in kickstarting this project.
After I got the foundations of the system working I started thinking of ways to add more feeds to it. That would help me find edge cases and see how the system coped under increased pressure. In order to do this I started searching online for people and organizations that operated stations and begun cold e-mailing them to ask if they would mind sharing it. Many radio-amateurs and education/research institutions have stations, so I started there.
Sharing data is usually a pretty simple process, mostly just a question of allowing me to connect to to a server to fetch the data or have the station owner configure an ip/port and start sending it to me, using software like ShipPlotter or NMEARouter. Nevertheless I was a bit terrified when I started sending the first few e-mails. I guess it was mostly a fear of rejection. Most people were incredibly polite and helpful though, going out of their way to aid me without asking nothing in return and sharing the joy of seeing their data come alive in the web application with me.
What surprised me the most was how guarded people were in universities, labs and other public institutions. Being publicly funded and dedicated to research, education or both I would have assumed they’d be more open to share their data with others that were also interested. The opposite was true: most rejections I got were from those sort of institutions. In one of them a lab director and professor even wrote saying that his university’s legal department was not allowing the data to be shared because of GDPR requirements [!] (after asking me what was in it for them if they shared it).
Technical info
One thing that I wanted to explore in this project was having interoperability between tiny applications with clearly limited and defined purposes. Another thing I wanted to try out was to have them programmed in various languages. That way I could make the most of each language’s and libraries strengths - the speed of rust, the versatility of dotnet, the rapid-prototyping of ruby. Central to implementing this is having ways for processes to communicate with one another. The rabbitmq message broker was essential to achieve this.
If the AIS data is the lifeblood of the system, its heart is the decoder application. It’s built in rust and has support for ten VDM/VDO message types. It works by picking up encoded messages fed to a rabbitmq worker queue by the station application and outputting the decoded results into a pub/sub exchange for other applications to consume. It was my first time coding with rust and I was really impressed with its borrow checker and user-friendly compiler messages.
Two dotnet applications subscribe to the decoded messages exchange. They include a persister that receives the decoded data and saves it to a relational database and a transmitter that also receives this data and accumulates information about the vessels and other objects before forwarding them through a signal-r hub for real time updating in the frontend. There’s also a third webapi dotnet application that serves the data that’s in the relational database, using a REST api.
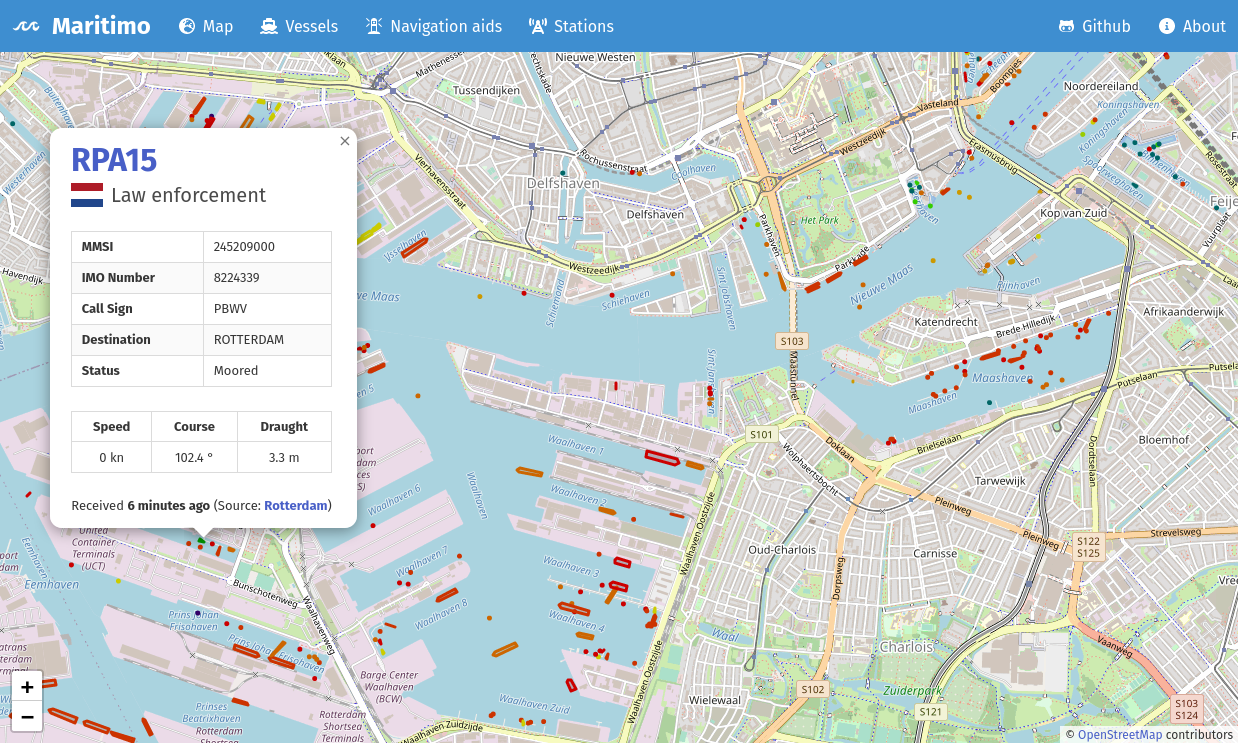
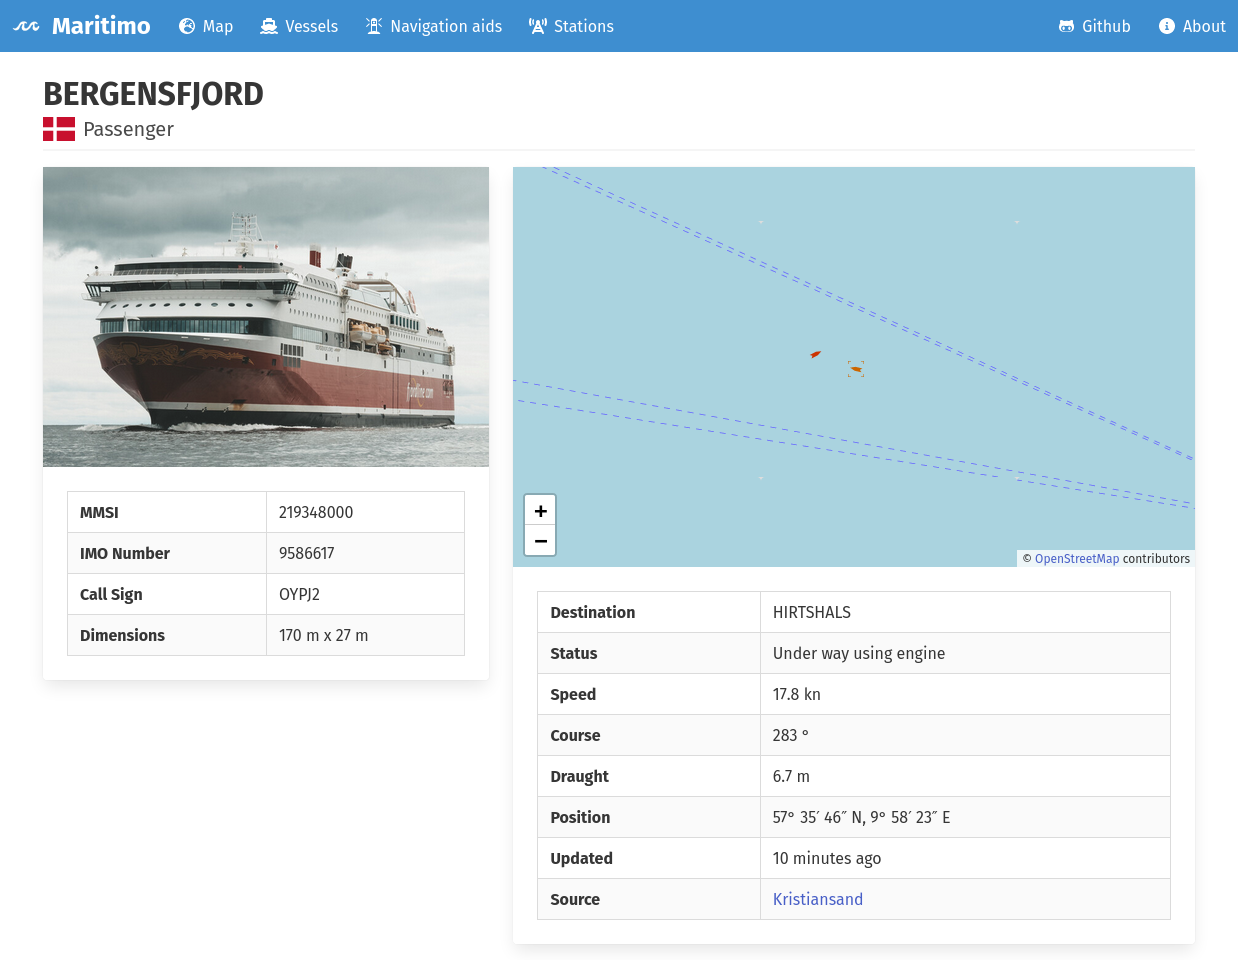
The frontend, a javascript/react web application powered by the leaflet map library and styled using bulma css displays the information received from the webapi and transmitter applications in a user-friendly format for the users.